brain training perks with neuroscience & neurolingistics cutting-edge knowledge, experience and trends will improve and boost your brain health and all your learning | education | lingüistics | english as a second language | ESL | ELT | second language acquisition | learning & teaching | neuroscience | neurology | holistic methodologies | management | effective communication | liaising with clients | travelling & tourism | general news | animal protectionism | youtube curator
Michelle, Hand Expert and founder of Virtual Hand Care, shows you her Top 5 Trigger Finger Treatments to help stop the triggering, catching, or locking of your finger.
Trigger finger is a very common hand condition that can greatly impact your motion, grip, and the use of your hand with daily activities.
22 Nov 2022
STOP squeezing or gripping a ball if you you have Trigger finger or trigger thumb. This is a very common exercise that is recommended for trigger finger. Yet there is NO evidence to prove repetitive gripping of a ball is an effective exercise to heal trigger fingers. However, there is an exercise with proven results.
25 Jan 2022
Michelle, Hand Expert and founder of Virtual Hand Care, show you how to Stop Trigger Finger or Trigger Thumb with this BAND-AID® Trick. This quick fix can help eliminate the triggering, catching, or locking of your finger. This BAND-AID® trick can stop or significantly decrease your finger and thumb from triggering so you can start using your hand more normally.
Also try this trick at night if your finger or thumb locking is preventing you from getting a good night sleep. Trigger finger and trigger thumb is a very common hand condition that can greatly impact the functional use of your hand with almost ALL daily activities.
But don’t just stop here, you will also want to use a combination of splinting, stretches, and exercises eliminate your trigger finger or trigger thumb.
Two Kinds Of Inflation: 2 Ways Of Protecting Your Portfolio.
Service Inflation: The Real Risk Right Now
How My $2 Million Family Fund Handles Sticky Inflation
Mar. 15, 2024 2:12 PM / The Dividend Kings by The Dividend Kings
Summary
Inflation is proving sticky, with CPI and core inflation increasing than expected.
Goods inflation, like in the 1970s, is a low-probability risk, while service inflation is the real concern.
Long-term prospects for the US economy and stock market remain positive, with potential for high productivity growth and strong corporate earnings.
Asset allocation is the #1 way to protect yourself from inflation, and all risks facing our portfolios, including your own emotions.
Here is how my ZEUS Family fund uses diversification and asset allocation to keep our savings safe in all economic and market conditions.
gesrey
Welcome to Wealth Wisdom Weekly, a Friday economics update video that uses my ZEUS Family fund as an example of navigating all economic and market conditions while sleeping well at night.
Let’s kick off our inaugural episode with sticky inflation, which is causing stocks a modicum of angst for now, but we all know it could cause some heartburn if inflation proves sticky.
First, let’s talk about the data itself, and then I’ll give you some context about what it means and whether or not it matters to the long-term investor’s portfolio.
FactSet Research Terminal
This week, the Consumer Price Index (CPI) was released on Tuesday, and the Producer Price Index (PPI) dropped on Thursday.
CPI is the headline inflation you see in the media report.
The Fed’s official metric is core PCE (personal consumption expenditure), which it wants to be between 1.5%, 2.5%, and 2% long-term.
CPI came in at 3.2% this week, 0.1% higher than expected.
Core came in at 3.8%, which was also higher than expected.
Reuters
Core inflation excludes food and fuel, volatility commodities that can swing wildly from month to month.
It appears inflation is getting stuck, stabilizing above 3%, and that’s well above the Fed’s 2% target.
Core PCE tends to be 0.5% below CPI, so the Fed’s target for CPI is approximately 2.5%
Two Kinds Of Inflation: 2 Ways Of Protecting Your Portfolio
There are different kinds of inflation, primarily goods vs service inflation.
Goods inflation, like the kind we saw in the Pandemic when supply chains were a mess and later when the Russian invasion of Ukraine caused energy prices to soar, and some metals, is the kind of inflation we saw in the 1970s.
Single Point Partners
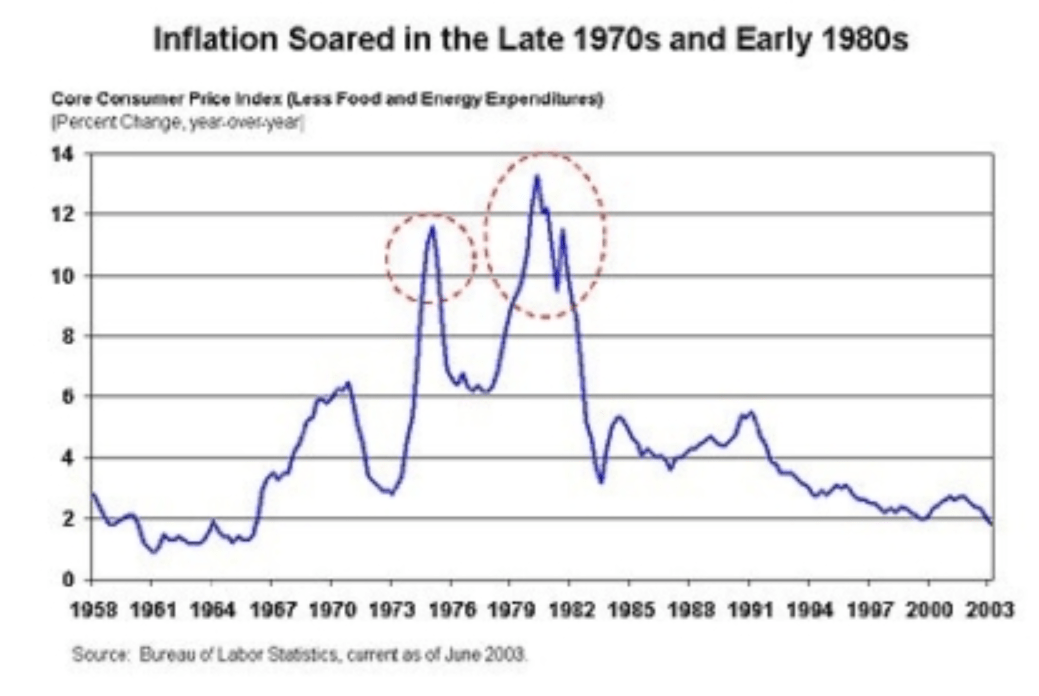
You might have seen some scary headlines about predictions that we might start another 1970s-style inflation double spike.
Single Point Partners
US inflation might end up going back up…to 11%! At least, that is what some people might want you to believe. And while not impossible, history rarely rhymes so perfectly.
In the 1970s, the super spike in the late 70s and early 80s was caused primarily by goods inflation, especially energy.
Energy prices more than doubled due to the Iranian Revolution and, in today’s dollars, were over $300.
Is it possible that geopolitics risks, say, the Gaza war turning into a shooting war between Israel and Iran, might cause crude to double and then double again as it did in the 1970s?
In the short term, you can always spin a plausible story worthy of a Tom Clancy novel or a big-budget Netflix blockbuster.
However, in reality, even a war between Israel and Iran that somehow sucked in the US, and other regional allies, is unlikely to sustain crude prices at the approximate $300 level necessary to drive inflation like in the 1970s.
Why I’m Not Worried About Crazy High Inflation
Let’s play out this doomsday scenario.
Iran funds Hamas.
Israel declares war on Iran and begins bombing them.
The US and its allies, like in the early 1990s, pick a side (declare war on Iran).
Iran begins attacking oil tankers in the straights of Hormuz.
Iran begins launching rockets at Saudi oil installations
Oil hits $300 per barrel within a matter of days
This is a plausible, if low probability, “fat tail risk” that could cause a big spike in short-term inflation.
However, unless oil prices kept rising for over one year, the inflation would, by definition, last less than one year.
Inflation is year-over-year price changes
And crude wouldn’t stay $300 for long, and here is why.
First, keeping crude that high would require Iran to keep Saudi production offline for months or years. That means a steady stream of missiles overwhelming their Iron Dome defenses.
The US has sold the same missile defense system to the Saudis to protect Hamas from Hamas rockets.
Keeping the straights of Hormuz closed would require lots of missiles and a navy Iran doesn’t have.
The US would act quickly in this hypothetical scenario. We’d sink every single Iranian ship.
Wikipedia
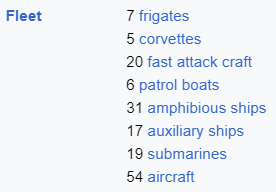
Iran’s navy consists of 105 small craft and 54 small aircraft.
Wikipedia
It’s not a small force, but the ships are not very modern, powerful, or capable of competing with the combined might of the Saudis, Israel, and the United States.
If Iran were to try to send crude prices to $300 by attacking global supply in the way I described, the US could likely sink every Iranian vessel within a matter of days, if not hours.
Israel most likely has excellent data on Iranian missile installations and could take those out in a matter of days or hours.
In September 2018, Houthi missiles hit Saudi Arabia’s Abqaiq and Khurais facilities and, for a few days, cut off 50% of Saudi supply.
5.7 million barrels per day of supply were out of commission, 5% of global supply.
Ycharts
Oil prices jumped 12% on the day of the attack and immediately fell back to normal.
According to Bloomberg News, as of September 27, 2022, Saudi Arabia’s oil production capacity and exports indicated that the industry was growing almost every day, and by December, the Saudis had fully recovered their lost production.
There was no recession in 2019 and no considerable inflation spike, even with 5% of the world’s oil supply being cut off overnight.
And remember, we’re wargaming a hypothetical worst-case scenario in which Iran and Israel are in a full-blown war, and Iran decides to try to wipe out and minimize Saudi oil supplies to hurt the West.
This scenario is a low probability fat tail, and history shows that even this would likely not bring us back to 1970s-style inflation.
Service Inflation: The Real Risk Right Now
About 70% of US GDP is tied to services, so service inflation is the real risk.
The dreaded “wage, price spiral.”
In the 1970s, US workers expected inflation to worsen, so they demanded ever higher wages to compensate. Companies passed that on at higher prices, so we hit a max inflation rate of about 14%.
While some headline-catching union wins against the Big Three and stories of McDonald’s paying $25 per hour in some Michigan stores, the actual data is here.
The plural of anecdote is anecdotes, not data.
The gold standard of wage data is the Atlanta Fed wage tracker for several reasons, the biggest of which is a cohort survey.
The Atlanta Fed’s wage growth tracker surveys the same people and then measures their hourly wages 12 months apart.
Using the same people over long periods smooths out irregularities as the Pandemic created.
Atlanta Fed
This wage growth tracker lets you break down wages by various demographics, and what it shows is that there is zero evidence of a wage-price spiral.
The 5% overall wage growth aligns with the Bureau of Labor Statistics 4.8% non-supervisory wage growth (80% of workers).
With productivity at 3.2%, this wage growth is consistent with 1.8% inflation.
Ycharts
Wage growth – productivity = proxy for long-term inflation.
Why is the market mildly upset about sticky inflation? The current data, per the Cleveland Fed, indicates that there is no evidence that inflation will come down rapidly and sustainably, and that’s what the bond market has to adjust for.
CNBC
Bond yields are drifting higher in a slow, controlled, orderly manner.
This is unlike the Q3 2023 face-ripping yield rally, in which 30-year yields rose the fastest in 30 years.
10 to 20 basis point changes
the highest bond market volatility ever recorded
worse than the Pandemic and Great Recession
In other words, the rate of yield change (interest rate changes) is what the market cares about.
That’s why 2-year yields, the market proxy for the Fed funds rate in the short-term, rose from 4% to 4.7% in 5 weeks, and the stock market went up 4%.
A strong economy is good for earnings, so slow rate increases don’t bother the stock market too much.
CME Group
Since 2008, the Fed has always done whatever is 80+% priced into the Fed futures market.
Right now, a July rate cut, which Powell told the Senate he was leaning towards, is most likely but no longer priced in as it was a few days ago.
At the end of December 2023, the market was pricing in 7 rate cuts in 2024, while the Fed was guiding for 3.
Three rate cuts in 2024 can be as late as September, November, and December.
The bond market is slowly pricing the risk of a rate hike waiting until September.
These probabilities change by the second as bond yields do, so they are not forecasts.
The Good News About Inflation Long-Term And The Economy
Ed Yardeni, one of the most respected economists in America, thinks 3% to 4% productivity will be achieved this decade, courtesy of 5G and AI.
JPMorgan thinks AI might boost productivity by as much as 4.5%.
Daily Shot
That would be the highest productivity boost in history, and Goldman agrees that AI could be a game-changer.
Goldman Sachs
Goldman’s baseline scenario is that AI will boost US GDP long-term from 1.6% to 3.1% and possibly as high as 4.5% (same as JPMorgan’s best case).
3.9% productivity growth in the 1920s was the best recorded in US history (backtested data; GDP didn’t exist before the depression), much less productivity measurements.
Why My Family Fund Is Max Bullish (40% Growth Focused)
Analyst Firm McKinsey published a 126-page report that’s even more optimistic about AI and productivity.
McKinsey research estimates that gen AI could add to the economy between $2.6 trillion and $4.4 trillion annually while increasing the impact of all artificial intelligence by 15 to 40 percent.” – McKinsey
$2.6 to $4.4 trillion in extra global GDP would mean a 2.5% to 4.3% annual boost in growth, which would also mean a 2.5% to 4.3% boost in productivity.
US GDP growth would then become (assuming similar productivity gains) 1.6% current productivity + 2.5% to 4.3% AI Boost + 0% to 0.3% population growth = 4.1% to 6.2% GDP growth.
What does 5% GDP growth potentially mean for America? How about 5% productivity growth?
Wage growth of 7% with 5% productivity = 2% inflation
5% inflation-adjusted wage growth = double your purchasing power in 14.4 years
According to Bank of America, for every 1% in GDP growth change, US corporate profits swing from 4% to 5%
5% GDP growth = 9.2% to 22.0% boost to corporate profits (above current expectations)
Congressional Budget Deficit estimates a $233 billion annual deficit change per 1% GDP change
3.4% better GDP growth, $782 billion, smaller annual deficit
The deficit to GDP falls to 3.2% of GDP, and long-term debt/GDP would fall steadily over time
Per Morningstar and FactSet, S&P’s profit growth for the next five years is expected to be approximately 11%.
11% + 9.2% to 22% = 20.2% to 33% EPS growth for S&P
+1.5% yield + 21.7% to 34.5% S&P 500 total return potential (justified 100% by fundamentals, no bubble)
Ritholtz Wealth Management
The 1950s were the best decade for stocks in history, with a Buffett-like 20.1% return for ten years.
Buffett’s historical returns have been 20.5% since he took over Berkshire.
The US stock market was up 525% in the 1950s, turning $1 into $6.25 (not adjusted for inflation).
Am I predicting a roaring 2020s like Ed Yardeni or Tom Lee at Fundastrat?
Not necessarily, but I think returns will likely be much better than many financial professionals currently expect.
Vanguard expects 6% to 7% S&P returns this decade.
If corporate profit growth of 10% to 12% (current rate) can be sustained, then non-bubble, fundamental returns of 11% to 13% for the S&P are possible this decade.
210% total return
9% to 11% inflation-adjusted returns per year
160% total real return from S&P over ten years (by the end of 2034)
That is what the data shows as the current base case in my market/economic model.
That forecast changes as the data comes from FactSet, Morningstar, Bloomberg, and other trusted sources.
But the point is that there are many reasons to remain bullish on America and our stock market right now.
Surviving The Short-Term To Live To A Glorious Future: How I Stay Calm And Sane During Crazy Times
As Howard Marks of OakTree Capital likes to remind us: “A 6-foot man can drown crossing a river that is 5 feet deep on average.”
In other words, sound risk management isn’t just about selecting the asset allocation and portfolio design that will most likely achieve the total returns you need in your specific time frame.
It requires a portfolio you can sleep well in at night when crazy stuff happens, like this.
Ycharts
If you can’t stomach a 13% decline in a single day, you can’t be 100% in stocks.
If you couldn’t stomach a decline like this, you would have sold everything in panic during the pandemic, near the final bottom.
But notice how long bonds went up 6% on March 16th, 2020, the 3rd worst day in US market history.
JPMorgan Asset Management
Long-duration US treasuries are the best historical hedge in a “risk off” panic.
And what if interest rates are the cause of the panic? Like in October 2022 and 2023? When did soaring rates cause stocks and bonds to crash?
RSBT
In the 1970s, managed futures delivered exceptional returns, so I combined managed futures with long bonds in my ZEUS Family fund.
Sharesight
Diversification of:
asset classes: bonds, stocks, managed futures
strategies: 40% growth, 30% value, 30% hedges
equity style: 50% ETFs and 50% individual high-conviction stocks
The ZEUS strategy, 33% ETFs, 33% hedges, and 33% stocks, is designed to fall 50% during bear markets.
My ZEUS Family Fund’s Peak Declines During Bear Markets
Bear Market
ZEUS Family Fund Peak Decline
60/40 Peak Decline
S&P Peak Decline
Nasdaq Peak Decline
2022 Stagflation
-17%
-21%
-28%
-35%
Pandemic Crash
-7%
-13%
-34%
-13%
2018 Recession Scare
-16%
-9%
-21%
-17%
2011 Debt Ceiling Crisis
-1%
-16%
-22%
-11%
Great Recession
-20%
-44%
-58%
-59%
Average
-12%
-21%
-33%
-27%
Median
-16%
-16%
-28%
-17%
(Source: Portfolio Visualizer Premium)
Today, ZEUS is acting precisely as it was designed to do, and that’s one of my mental hacks, which is to focus on the methodology.
If the market falls 10% today and I lose just 4% to 6%? I consider it a glorious victory.
Because ZEUS is working, I focus on the strategy, not short-term results.
In the short term, anything can happen; in the long term, fundamentals dominate
DK S&P Valuation Tool
Investing Lesson of The Week: If You Can’t Stomach Volatility…Don’t
The first rule of compounding: Never interrupt it unnecessarily.” – Charlie Munger
Stock Allocation
Hedges Allocation
Average Bear Market Peak Decline (34% S&P Decline)
100%
0%
-34%
90%
10%
-27%
80%
20%
-21%
70%
30%
-14%
66.66%
33.34%
-12%
60%
40%
-7%
50%
50%
-1%
40%
60%
6%
30%
70%
13%
20%
80%
20%
10%
90%
26%
0%
100%
33%
(Sources: Portfolio Visualizer, Charlie Bilello, Ycharts)
The best asset allocation for you is whatever you won’t panic sell in a crisis.
Here are the average historical declines based on asset allocation.
Hedges = 50% long bonds and 50% managed futures
Wide Moat Research
Remember that no portfolio will work all the time. But if you have realistic expectations, you can sleep well at night regardless of the economy, stock market, inflation, or the Fed’s actions.
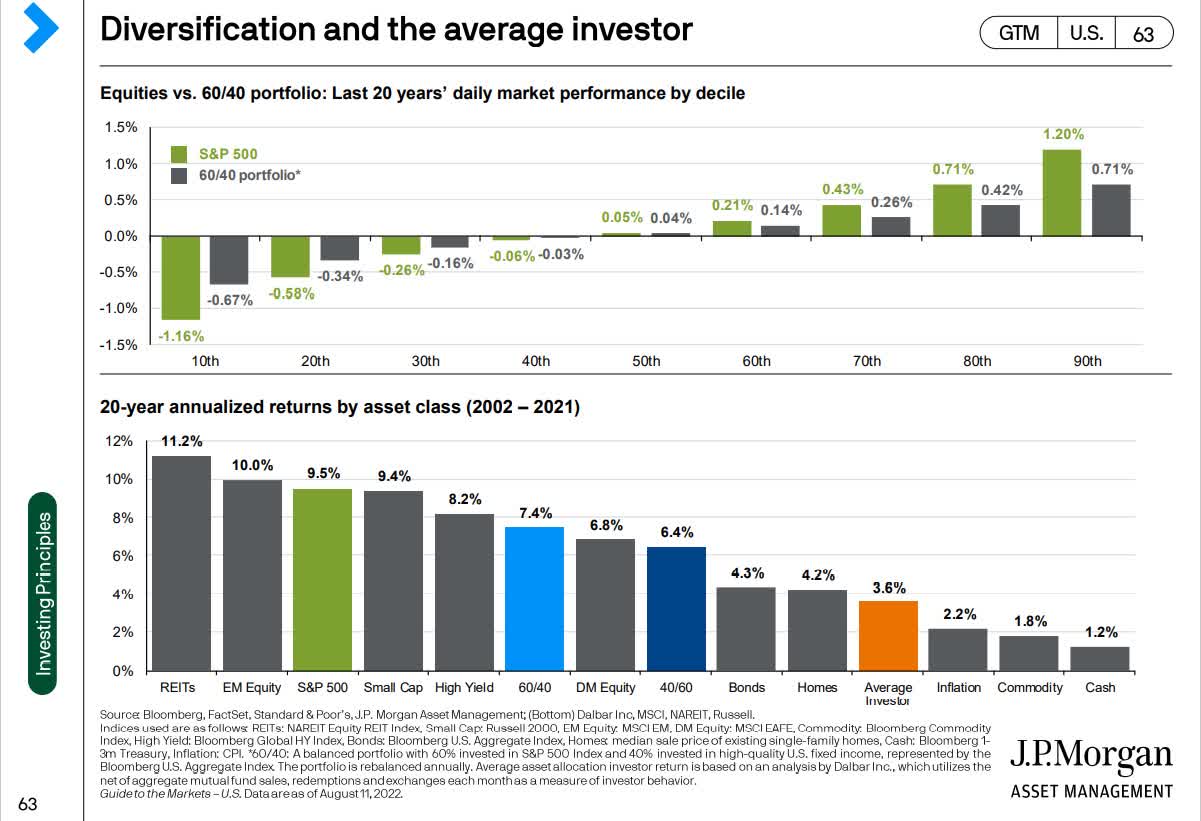
JPMorgan Asset Management
You can avoid the curse of market timing, which caused average investors to enjoy 29% real returns from 2002 to 2021 while the S&P tripled.
According to JPMorgan, nearly all this underperformance was due to market timing.
Recommendation of The Week: What In The ZEUS Family Fund Is A Potentially Good Buy Today
My favorite hedge against inflation surprises is the KFA Mount Lucas Managed Futures Index Strategy ETF (KMLM).
I have strong confidence in this ETF‘s ability to deliver good hedging power in future downturns and positive long-term returns, and here’s why.
KraneShares
It uses a rules-based trend-following strategy on 22 highly liquid futures markets.
KraneShares
There is no exposure to stocks. That’s why KMLM tends to do better on days when stocks are falling than managed futures funds with exposure to stocks.
During a bull market, they follow the trend of “stocks up.” they buy stocks.
and during a downturn, they are a weaker hedge against falling stocks
KMLM avoids stocks for this reason
And thus has better hedging power (higher negative correlation in a downturn)
Seeking Alpha
Note that HFND is the ETF tracking the entire hedge fund industry. Note how it’s merely falling less than the market.
I want my hedges to go up in a falling market, so they are hedges.
KMLM tracks the world’s best-performing managed futures index, which has delivered 2X the industry’s returns for 32 years.
9% annualized returns when managed futures delivered 4.5% and bonds 4%.
KMLM charges a 0.9% expense ratio, so the return would have been 8.1% per year had it existed
Crisis Period
US Stocks
Bonds
Long Bonds
Cash
RSBT
DBMF
KMLM
50/50% Long Bonds And KMLM
December 2021 to September 2022
-25%
-14.4%
-44.8%
0.6%
28.7%
31.6%
44.8%
0.0%
January 2020 to March 2020 (Pandemic)
-20%
-2.6%
20.3%
0.3%
0.3%
-0.8%
13.9%
17.1%
October 2007 to February 2009 (Great Recession)
-50%
6.1%
24.0%
2.5%
25.9%
13.5%
37.4%
30.7%
August 2000 to December 2002 (Tech Crash)
-41%
33.4%
149.6%
11.2%
78.6%
28.8%
30.4%
90.0%
Average
-34%
5.6%
37.3%
3.6%
33.4%
18.3%
31.6%
34.5%
(Sources: Portfolio Visualizer, Charlie Bilello, Ycharts)
In the last quarter century, there hasn’t been a significant bear market where KMLM and long-bonds failed (went down). They are a highly successful way to minimize volatility to levels you can emotionally stand.
Bottom Line: The Future Of America Is Brighter Than Ever
Next week, I will go through Jensen Huang’s GTC presentation (a summary version) and show you why the future of America, humanity, and the world is brighter than ever.
Atlanta Fed
Until then, sleep well and enjoy your weekend because the US economy remains the envy of the world.
Europe and Japan are in a mild recession, and China’s economy is struggling under a mountain of bad real estate.
The US economy, which defied all expectations just one year ago, continues to grow at a steady pace of 2% to 3%, and according to the Atlanta and NY Fed, there is no sign that this will stop anytime soon.
Atlanta Fed
2% to 2.5% growth for as far as the eye can see, and corporate earnings?
And what if the Fed does have to hike rates? What if inflation is sticky and doesn’t come down for a year? How high might the Fed have to go?
Atlanta Fed
In the worst case, the Fed has to hike once more (likely in December), and if that doesn’t solve inflation, current economic data indicates that the Fed might have to hike twice more.
Likely at the end of 2025
And that would be good for stocks. Why? Because earnings trump all! Interest rates affect the PE of stocks. However, earnings growth can overcome higher rates.
Let’s not forget the 6% rates in the roaring 1990s, a time of 4% GDP growth and a booming stock market.
That was a bubble, with tech stocks trading at absurd valuations as high as 1,000 X sales.
Today’s tech giants are minting cash and trading at reasonable valuations relative to strong earnings growth rates.
Emerging Markets Earnings Growth
Emerging markets earnings growth consensus 2023-2026: 15% or 4.7% annually.
China Earnings Growth
FactSet Research Terminal
China earnings growth consensus 2023-2026: 25% or 7.6% annually (faster than emerging markets).
Europe Earnings Growth
FactSet Research Terminal
Europe earnings growth consensus 2023-2026: 26% or 8% annually (faster than China)
Japan Earnings Growth
FactSet Research Terminal
Japan earnings growth consensus 2023-2026: 33% or 10% annually (faster than Europe)
US Earnings Growth
FactSet Research Terminal
S&P earnings growth consensus 2023-2026: 43% or 12.6% annually (faster than Japan’s, Europe’s, China’s, or collective emerging markets)
China is a prison, Japan is a Nursing Home, Europe is a Museum, so where else are you going to invest.” – Larry Summers
Please have a safe, healthy, and relaxing week.
Analyst’s Disclosure: I/we have a beneficial long position in the shares of kmlm either through stock ownership, options, or other derivatives.
I wrote this article myself, and it expresses my own opinions. I am not receiving compensation for it. I have no business relationship with any company whose stock is mentioned in this article.
Seeking Alpha’s Disclosure: Past performance is no guarantee of future results. No recommendation or advice is being given as to whether any investment is suitable for a particular investor. Any views or opinions expressed above may not reflect those of Seeking Alpha as a whole. Seeking Alpha is not a licensed securities dealer, broker or US investment adviser or investment bank. Our analysts are third party authors that include both professional investors and individual investors who may not be licensed or certified by any institute or regulatory body.
Mar. 14, 2024 3:07 PM ET / DIY Value Investing by Chris Lau
Summary
The article discusses the potential downfall of EV companies Lucid, Fisker, Polestar, and Rivian.
The importance of being aware of warning signs and not being the last to enter the market.
The article also mentions a warning about China’s real estate contagion.
Robert Way
Posted last November and considered a late warning, EV Flop, Which Of These 4 Will Fall To Zero: Lucid, Fisker, Polestar, Or Rivian may take its first victim.
Crashes happen slowly, then all at once. Compare this to a fire that slowly burns. No one notices. As the smoke builds, people start to notice.
Panic ensues.
How I knew:
CEO Fisker unfortunately had a history of filing for bankruptcy
When inflation rose, rates rose, and consumer income levels fell.
EV Flop mirrored the Covid vaccine rise and fall
Fisker was not first to the EV market. Tesla (TSLA) was. IF you are not first, you are LAST.
Next Warning: China’s Real Estate Contagion, based on my 35 years of experience and a renewed 3-year research plan on its downfall.
Analyst’s Disclosure: I/we have no stock, option or similar derivative position in any of the companies mentioned, and no plans to initiate any such positions within the next 72 hours.
I wrote this article myself, and it expresses my own opinions. I am not receiving compensation for it. I have no business relationship with any company whose stock is mentioned in this article.
Seeking Alpha’s Disclosure: Past performance is no guarantee of future results. No recommendation or advice is being given as to whether any investment is suitable for a particular investor. Any views or opinions expressed above may not reflect those of Seeking Alpha as a whole. Seeking Alpha is not a licensed securities dealer, broker or US investment adviser or investment bank. Our analysts are third party authors that include both professional investors and individual investors who may not be licensed or certified by any institute or regulatory body.
Research is an add-on features on the stock screening companion site for DIY Value Investing. Many followers choose the Research-only reports, which outputs detailed data one stock at a time.
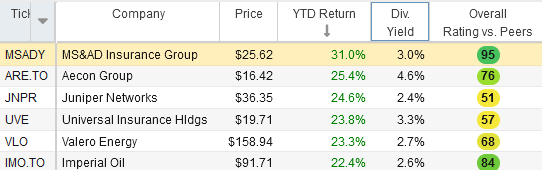
Analysts, whom are highly regarded, have between a hold and strong buy rating. Ignore them, as always. Make use of the analyst’s power to move markets to buy stocks at a discount and sell when they upgrade them.
Source: Research.
With the above definitions of value, growth, and quality in mind, look at DXT compared to its peers.
Time your purchase. Seasonally, DXT stock does not perform well until May through Sept., then again between Nov. to Dec.
From Research, page 4.
Dexterra‘s Cap Ex is the only data point to watch. However, revenue grew while net income is inconsistent.
How does DXT compare to BDI?
Cap Ex is similarly growing but free cash flow improved between 2022-2023 (view the “Cash Flow” section, third from the bottom).
Analysts rate BDI a strong buy. Thus, it’s probability a stock to sell or avoid at this time.
From Research, Page 1.
BDI stock tripled since 2019.
We do not look back. As such, BDI would not qualify to join the DIY Triples (300% return mandate), unless it has three-fold in upside. Its margin of safety is only 1%.
Analyst’s Disclosure: I/we have no stock, option or similar derivative position in any of the companies mentioned, and no plans to initiate any such positions within the next 72 hours.
I wrote this article myself, and it expresses my own opinions. I am not receiving compensation for it. I have no business relationship with any company whose stock is mentioned in this article.
Seeking Alpha’s Disclosure: Past performance is no guarantee of future results. No recommendation or advice is being given as to whether any investment is suitable for a particular investor. Any views or opinions expressed above may not reflect those of Seeking Alpha as a whole. Seeking Alpha is not a licensed securities dealer, broker or US investment adviser or investment bank. Our analysts are third party authors that include both professional investors and individual investors who may not be licensed or certified by any institute or regulatory body.
Mar. 15, 2024 12:00 PM ET BSQKZ, PAGS, SQ, STNE / Steven Cress, Quant Team SA Quant Strategist
This article reviews three fintech stocks with Strong Buy ratings, picking securities with the strongest collective value, growth, profitability, EPS Revisions, and price momentum vs. the sector.
Summary Fintech is projected (by QED Investors) to reach $1.5 trillion (~20% CAGR) by 2030, driven by massive and rapid digital adoption within the traditional financial services industry.
Fintech growth is projected to be especially pronounced in the Latin American markets, led by Brazil and Mexico, at a CAGR of nearly 30% during the same time period.
Three payment processing and banking stocks, including two with primary markets in Brazil, and one U.S.-based giant looking to expand globally, top SA’s fintech Strong Buy list.
Woman using computer Laptop conducting online financial transactions through the internet. The concept of Mobile Banking or Virtual Banking technology that is convenient, emphasizing safety. Sukanya Sonlila/iStock via Getty Images
Financials (XLF) are rallying as one of the top-performing sectors YTD and over the last 12 months, with shares of banks and other financial institutions capitalizing on AI trends. The technology boom with tailwinds from artificial intelligence has supercharged the markets, and Big Tech is driving major index gains over the past 12 months.
Big Tech 1Y Gains vs. The Rest Big Tech 1Y Gains vs. The Rest (Bloomberg)
Global fintech revenue, per a QED Investors/Boston Consulting Group study, is projected to grow by a CAGR of over 20%, reaching $1.5 trillion by 2030, as disruptors continue penetrating the traditional financial services markets amid the banking industry’s digital adoption and transformation.
Global Fintech Boom
Fintech companies provide solutions and technologies that automate and enhance traditional financial activities for consumers and businesses. Fintech applications cover a wide range of areas, including mobile and in-store payment processing, online banking, trading, investing, and B2B transactions, to name a few. Global banking services revenue will reach $10.2 trillion by 2030, according to the BCG/QED study, and fintech’s share of the industry is projected to grow from 4% in 2021 to 13%. Despite massive growth in recent years, the study said, “The financial services industry remains fertile ground for disruption.” Moreover, fintech penetration of banking valuations will grow from 9% to 25%. The fintech sector in North America is expected to quadruple by 2030 from where it was in 2021, and Latin American markets are set to grow by a factor of 12.5x.
Fintech Market Boom Fintech Market Forecast by Region (BCG Consulting)
This massive potential upside has been reflected in skyrocketing stock prices of major fintech companies. The ARK Fintech Innovation ETF (ARKF), which consists of nearly 40 fintech stocks, is up around 75% in the past year.
ARKF Fintech ETF 1Y Price Performance
ARKF vs. Market & Industry Benchmarks ARKF vs. Market & Industry Benchmarks (SA Premium)
ARKF is heavily weighted, with the top 10 stocks accounting for over 60% of value and one stock, Coinbase (COIN), making up almost 15% of the portfolio. However, only two of the stocks in the fund are Quant-rated Strong Buys. In fact, only five among quant-rated stocks in the fintech payment processing industry are Strong Buys, two of which top SA’s best fintech stock list.
Best Fintech Stocks
Investors can find attractive fintech stocks to invest in, and at the right time, based on recommendations generated by SA’s quantitative stock rating system, which has a proven track record of strongly predicting future returns. SA Quant Ratings are based on over 100 underlying metrics that are systematically gathered, analyzed, and graded across five factors: Valuation, Growth, Profitability, Momentum, and EPS Revisions.
Two of the three stocks on the top fintech list have primary markets in Brazil, while the third, a U.S.-based giant, sees an opportunity for significant expansion internationally. All three of the SA Quant Team’s top fintech stocks have top marks in momentum and solid growth metrics. In addition to a Strong Buy Quant Ratings, the stocks have Buy ratings from SA and Wall Street Analysts.
Best Fintech Quant Metrics Best Fintech Stocks Quant Ratings & Factor Grades (SA Premium)
1. Block, Inc. (SQ) Market Capitalization: $53.03B
Quant Rating: Strong Buy
Quant Sector Ranking (as of 3/14/24): 16 out of 693
Quant Industry Ranking (as of 3/14/24): 1 out of 43
Block, Inc, co-founded by Jack Dorsey, is the parent company of the Square business payment platform and mobile payment service Cash App. Block is #1 among SA quant-rated Transaction & Payment Processing Services stocks and #16 in the Financials sector. The stock surged 17% on February 23rd, after boosting full-year 2024 adjusted EBITDA guidance at the end of February. Block entered Strong Buy territory just recently on strong momentum, up 22% within the past three months. Block has indicated opportunities for significant growth, given the company has only a 5% share of a total addressable market of $205 billion ($130 billion for Square and $75 billion for Cash App). The total addressable market has grown 28% since 2020. Block, currently with over 90% of sales deriving from North America, sees a major opportunity to expand internationally. Chief Operating Officer Amrita Ahuja, in the Q423 call, said Block sees a “long runway for growth” outside the U.S.
The stock’s Strong Buy rating is heavily driven by favourable EPS revisions and forward growth metrics. Block has an astounding 33 earnings up revisions in the last three months to 4 down revisions.
According to consensus estimates, EPS is projected to grow 84% in FY24, 27% in FY25, and almost 30% in FY26. The consensus EPS target for the current fiscal year has been revised upward by 12% in 90 days and 37% in the past six months.
The solid prospects are also key to Block’s A+ Growth Grade. Block’s forward EPS long-term (3-5 year CAGR) is +38%, 325% above the sector median of about 9%. Block’s forward EBITDA growth rate of +50% and operating cash flow growth forward of +162% are also impressive. Although its Valuation Grade is a C+, SQ has a solid forward PEG ratio of 0.62x, about 50% below the sector median.
2. PagSeguro Digital Ltd. (PAGS) Market Capitalization: $4.42B
Quant Rating: Strong Buy
Quant Sector Ranking (as of 3/14/24): 18 out of 693
Quant Industry Ranking (as of 3/14/24): 2 out of 43
PagSeguro Digital Ltd. provides financial technology solutions and services for consumers and businesses and is the second largest neobank in Brazil. PAGS, up ~70% in the past year, is soundly outperforming the S&P 500 (+34), the SPDR financial select sector index (+11%), and the median of quant-rated financial sector stocks (+1%), which is driving an A+ momentum grade.
PAGS posted an all-time high in annual net income in 2023 and, according to 2024 guidance, aims to grow total payment volume (TPV) by 12-16% after YoY growth of 21%. PAGS guided to net income growth of 16-22% in FY24. Q423 EPS of $0.33 beat by $0.03, and revenue of $874.3 million (YoY) beat by $30.1 million. According to consensus estimates, EPS is projected to grow 17% in FY24, and another 15% in FY25. PAGS has an impressive 11 up earnings revisions in the past 90 days, securing an ‘A’ Revisions Grade, which rose from a B in the wake of the February 28 earnings and guidance announcement.
PAGS long-term EPS growth forward, a heavily weighted quantitative metric, is 13%, and EBIT FWD is over 30%. PAGS forward PEG ratio is 0.76x, a 40% discount to the sector.
Quant Sector Ranking (as of 3/13/24): 67 out of 693
Quant Industry Ranking (as of 3/13/24): 5 out of 43
StoneCo. Ltd. provides financial technology and software solutions to merchants and integrated partners to conduct electronic commerce across in-store, online, and mobile channels in Brazil. STNE is up more than 100% in the past year, while the sector (XLF) is up 29% versus the S&P 500, +34%.
STNE growth metrics crush the sector median. STNE’s forward EBIT growth rate is at 82% vs. a sector median of 3.8%, and forward EBITDA growth is 66%. STNE forward EPS Diluted Growth is 108%, and forward EPS Long-Term Growth is 62%.
STNE Growth Grade STNE Growth Grade (SA Premium)
STNE has 5 up revisions and 1 down revision in the past 90 days, with FY23 revenue projected to grow by 178% and 42% in FY24. Stone’s forward PEG ratio is also solid, carrying much weight behind its A- Valuation Grade. The forward PEG ratio of 0.29 is 77% below the sector median. STNE is both fast-growing and profitable with gross margins of 78%.
SQ, PAGS, and STNE look like attractive investments, sitting at the top of the SA Quant Team’s list of quant-rated fintech stocks, showcasing solid profitable growth prospects according to quantitative factor grades and underlying metrics.
Concluding Summary
The global fintech market is projected to continue booming and is forecast to grow by a CAGR of over 20% through 2030.Traditional financial services are undergoing radical transformations through rapid digital adoption. Growth will be especially pronounced in emerging markets such as Latin America, led by countries like Brazil. The SA Quant Team recommends three fintech stocks, two with primary markets in Brazil and a U.S. giant set to expand globally.
All three fintech stocks have strong momentum and forward profitable growth metrics. In addition to top fintech stocks, if you’re seeking a limited number of monthly ideas from the hundreds of top quant Strong Buy rated stocks.
Editor’s Note: This article discusses one or more securities that do not trade on a major U.S. exchange. Please be aware of the risks associated with these stocks.
I am Steven Cress, Head of Quantitative Strategies at Seeking Alpha. I manage the quant ratings and factor grades on stocks and ETFs in Seeking Alpha Premium. I also lead Alpha Picks, which selects the two most attractive stocks to buy each month, and also determines when to sell them.
Coming dividend dates & earnings to analyse the most suitable options for you.
Wall Street Brunch: Fed And Nvidia Vie For Market Sway
Mar. 17, 2024 3:19 PM / NVIDIA Corporation (NVDA) Stock RDDT, NKE, META
Wall Street Breakfast
Summary
Nvidia’s GTC conference and the Fed’s decision are the focus this week.
Reddit’s highly anticipated IPO is set to debut.
Nike and FedEx will report earnings, while Meta Platforms is being investigated for drug sales on its social media platforms.
Spencer Platt/Getty Images News
Nvidia’s GTC is now the AI Woodstock. (0:52) The Fed’s new dot-plot will be the big focus. (1:37) Reddit set to start trading. (2:24)
The following is an abridged transcript:
The top stories to look out for this week
Rocky and Apollo. Napoleon and Wellington. Batman and The Joker. You can take a side on which one of this powerful pair is going to jolt the market this week: The Fed or Nvidia (NASDAQ:NVDA).
AI has bested interest rates in the stock market so far, pushing equities to record highs despite a return on cash not seen in more than 15 years.
This week we get Nvidia’s GPU Technology Conference, known as GTC to most and the AI Woodstock to Wall Street. The Federal Open Market Committee will make its decision on Wednesday.
Going chronologically, Wedbush says GTC attendees will be looking for commentary of liquid cooling needs for the powerful architecture and that “one of the struggles for liquid cooling in gaining traction has been a lack of a standard implementation.”
From a stock perspective, Investing Group Leader Livy Investment Research says that “Nvidia is currently trading exactly at where it should be b ased on historical observations” and that “momentum is expected to pick up gradually post-GTC, and more prominently approaching the F1Q25 period-end and on the heels of said earnings release.”
But if Nvidia is Yul Brenner’s Chris, leading the Magnificent 7 against impossible odds, then the Fed is Eli Wallach’s Calvera, the nemesis ready to shoot down high valuations with higher-for-longer raids on equity enthusiasm.
The Fed decision is a fait accompli with trader pricing in a near certainty of now move. But attention has turned to the Summary of Economic Projections, also known as the dot plot, to see if the FOMC has been spooked by the latest hot inflation data.
Carol Schleif, chief investment officer at BMO Family Office says: “The earliest possible cut could be June, though we wouldn’t be shocked to see that delayed to later in the year if the data continues to come in hot as recent data has.”
Wells Fargo’s economists say that “beneath the robust headline figures, we see building evidence that the labor market is cooling and inflation is still slowing on trend.”
They “look for 100 bps of easing in total this year and another 100 bps of easing over the course of 2025 to bring the fed funds target range to 3.25%-3.50% by year-end 2025.”
Reddit (RDDT) headlines the IPO calendar with its much-anticipated debut. The social media company is expected to price 22M shares between $31 and $34 per share, raising up to $748M with the deal.
SA Analyst Mountainside Research is skeptical. They say there “are concerns about their lack of profitability, reliance on advertising. (and) their optimistic valuation,” adding “based on how other recent IPOs have been received by the market, Reddit may have a rocky start.”
Looking to earnings
It’s a loaded end of the week. Nike (NKE) and FedEx (FDX) report on Thursday.
Analyst Bela Lakos says from a valuation standpoint, Nike “provides little upside potential at the current levels and “the challenging macroeconomic environment, including the conflict on the Red Sea and its impacts on the Suez Canal traffic, is likely to have a meaningful impact on the upcoming results.”
Hedgeye made a FedEx long call this past week, saying it “will ride the tide of demand and pricing, albeit with some issues around surcharges that can lag.”
Analsyt Jay Van Sciver says: “We expect FY3Q results reported later this month to be the worst of it, with a management team looking for good news likely to chirp about improving industry trends in the spring. Could FDX miss on March 21? Yes, although we don’t see a probable scenario for a meaningful one. Could the shares trade up the next day? This is a risk business.”
Other earnings on tap are Tencent Music on Tuesday, Micron Technology (MU), Signet Jewelers (SIG), General Mills (GIS) and Five Below (FIVE) on Wednesday. And Lululemon (LULU) and Darden Restaurants (DRI) also on Thursday.
Among the top stories of the weekend
Federal officials have launched a probe into Meta Platforms (META) over concerns that the company’s social media platforms are benefiting from the illegal sale of drugs. That’s according to the Wall Street Journal.
As part of a criminal grand jury probe, the U.S. prosecutors in Virginia have been sending subpoenas and seeking responses from the tech giant, the owner of Instagram and Facebook. The officials are investigating whether the company’s social media platforms are enabling and profiting from the illicit sale of drugs. The FDA is also assisting the probe.
And Tesla (TSLA) plans to raise prices for its Model Y midsize electric SUV in both the U.S. and several European countries.
The company said that prices in the U.S. will increase by $1,000 for all Model Y cars on April 1. Tesla (TSLA) followed that up by saying that Model Y prices would rise across a number of countries in Europe on March 22 by about EUR 2K or the equivalent in local currencies. TSLA stock has been hamstrung by recent price cuts and is one of the lowest-peforming stocks in the S&P year to date.
For income investors
Here are some companies that have an ex-dividend date coming next week:
Kohl’s (KSS) has its ex-dividend date on March 19 with a payout date of April 3. Best Buy (BBY) goes es-dividend March 20 with the payout date of April 11 Broadcom (AVGO) has an ex-dividend date on March 20 as well, with its payout date on March 29. And Phillip Morris (PM) goes ex-dividend date on March 20 with a payout date of April 9.
And in the Wall Street Research Corner
Analysts from BofA Securities are out with their small-cap quantitative sector ranks.
Analysts ranked sectors based on estimate revisions, relative valuation compared to history, price momentum and rating changes to gauge investor sentiment.
The analysts said: “We found that the net proportion of upgrades-downgrades in a sector by our analysts is positively correlated with subsequent returns, particularly over the short term.”
Financials (PSCF) ranked first and consumer discretionary (PSCD) second, up from fourth place in January. Consumer discretionary (PSCD), real estate, and materials (PSCM) saw the biggest improvements in ranks, moving from fourth to second, from sixth to fourth, and from seventh to fifth, respectively.
Communication services (PSCU) saw the biggest deterioration, falling to sixth from second. Utilities ranked las again.
And Happy St. Patrick’s Day to our listeners. As the venerable Art Cashin said: watch for the canary in the coal mine.


